
About Edrawmax
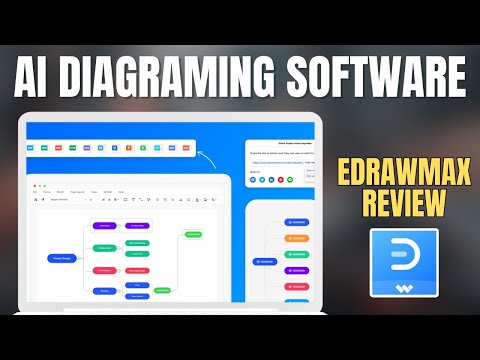
Edrawmax is a diagramming software with integrated AI features. It helps you generate flowcharts, mind maps, and other visual diagrams from text to streamline your workflow.
✅ Pros
- ✔️ AI Draw: Text prompt to visual graphics.
- ✔️ Template: Huge library for every domain.
- ✔️ Any OS: Web, Win, Mac, or Linux support.
- ✔️ Vector: Scalable art without any blurr.
- ✔️ Data-Sync: Link real data for live chart.
❌ Cons
- ✖️ Paid Plan: Full AI features need a sub.
- ✖️ Learning: Many tools can overwhelm users.
- ✖️ Install: Desktop version needs setup time.
- ✖️ AI Trust: Manual fixes needed for output.
Key Features

Ready-to-Use Prompts
Copy and customize these prompts for your specific needs
Create a [type of diagram: flowchart / org chart / mind map / network diagram].
Show [specific elements: people, steps, tools, or processes] in logical order.
Design it to be [style: simple, professional, colorful, or clear] with proper labels.
Ensure it is useful for [purpose: study, planning, or decision-making].
Generate a [diagram type: timeline / chart / workflow / tree diagram].
Add [important items, stages, or relationships] in sequence.
Keep it [style: neat, easy-to-read, or presentation-ready].
Highlight details needed for [purpose: learning, reporting, or analysis].
Design a [diagram type: mind map / flowchart / process diagram].
Include [key ideas, steps, or connections] clearly.
Use [style: colorful, professional, or simple] formatting with labels.
Make it practical for [purpose: teaching, business, or daily use].
Draw a [type of diagram: organizational chart / workflow / system diagram].
Show [roles, steps, or components] in structured form.
Ensure [style: clean, professional, or easy-to-follow] presentation.
Keep it relevant for [purpose: planning, teamwork, or explanation].
Create a [diagram type: Gantt chart / decision tree / workflow].
Add [tasks, options, or decision paths] with clarity.
Format it in a [style: organized, clear, or business-like] way.
Make it effective for [purpose: project, analysis, or planning].
Customer Reviews
Pricing Plans
Free Plan
Paid Plans
Plan: Subscription Plans (Semi-Annual) – US$45.99
Automatically renew, cancel any time.
1-year free upgrades and priority support
1-year access on 3 PCs & 3 mobiles & EdrawMax Online
1-year access to all features
1GB free cloud storage
Plan: Perpetual Plan – US$99.99
One-time payment.
Forever to use EdrawMax V14 (desktop)
3-year access on mobiles and online
Access to all features
10GB free cloud storage
Plan: Perpetual Bundle Plan – US$109.99
One-time payment.
EdrawMax V14 (desktop)
EdrawMind V12 (desktop) – A collaborative and versatile mind mapping tool to capture, organize and share ideas visually
3-year access on mobiles and online
20GB free cloud storage